How to Use Google PageSpeed Insights (Beginner's Guide 2024)

Mar 12, 2024
As a website owner, optimizing your SEO rankings, accessibility, and performance is your top priority.
One area you should really care about is website speed, as Google highly prioritizes user experience. So, the more you improve it, the better position you can gain on SERP.
Currently, one of the most innovative solutions to check and optimize website speed is Google PageSpeed Insights. However, the terms used in the report can be confusing for non-technical people. So, how do you figure out your website’s performance without getting lost in technical jargon?
Well, no need to stress. In this blog, you’ll learn how to use PageSpeed Insights effortlessly with all those tricky technical terms. Moreover, we’ll also understand how they affect your website, tips by PSI on improving your website performance, and much more.
Let's start by getting to know Google PageSpeed Insights.
Term Introduction
As you begin reading, you'll come across these terms, which you may be unfamiliar with. So, let’s understand them before proceeding.
1. Field Data: Field data, or Real User Monitoring (RUM) data, showcases how real users interact with your website. These data are extracted from the Chrome User Experience Report (CrUX), a database that records the browsing experiences of actual Chrome users.
2. Lab Data: Lab data is collected in a controlled environment using speed test tools like Lighthouse. These tools load your website with predetermined device and network connection settings to measure performance, you can also refer to them as an artificial website test.
What is Google PageSpeed Insights (PSI)?
Google PageSpeed Insights, a free performance testing tool that analyzes website load time, responsiveness, and visual stability on both mobile and desktop platforms. These data are gathered from the Chrome User Experience Report and the Lighthouse API, offering a mix of both field data and lab data.
The field data provides insights into how the website is performing as per Google core web vitals, while the lab data assigns a score to your website, ranging from 0 to 100. A higher score indicates good website speed and efficiency.
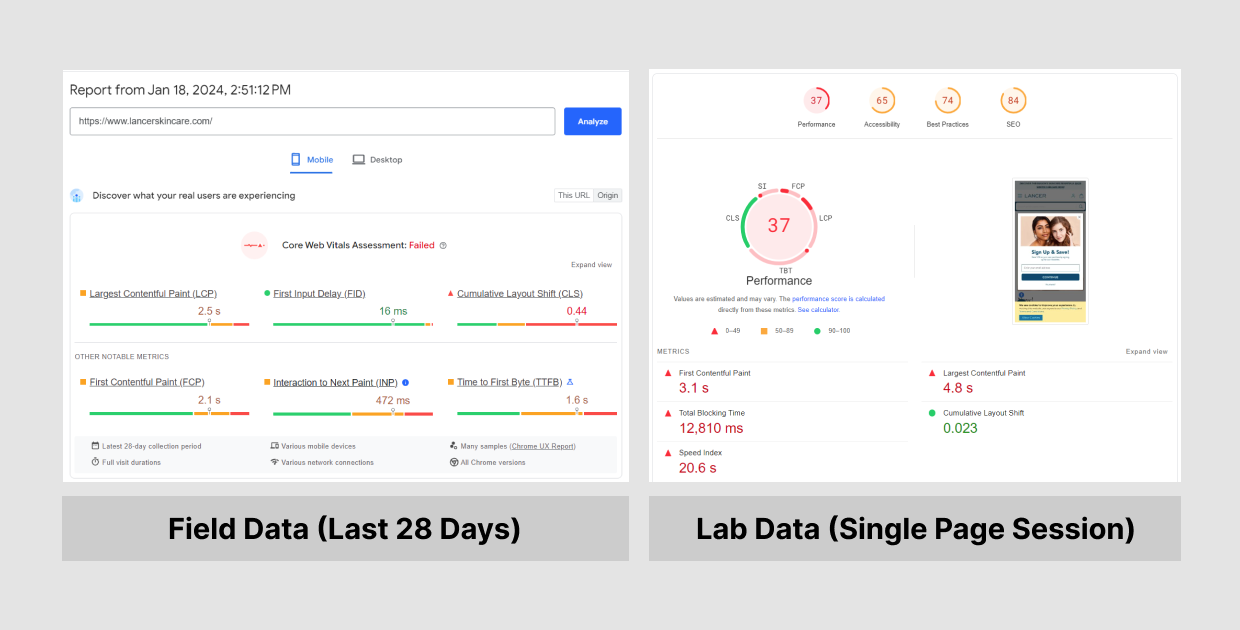
Additionally, PageSpeed Insights offers performance recommendations based on the latest industry best practices, helping website owners improve web performance for both mobile and desktop sites.
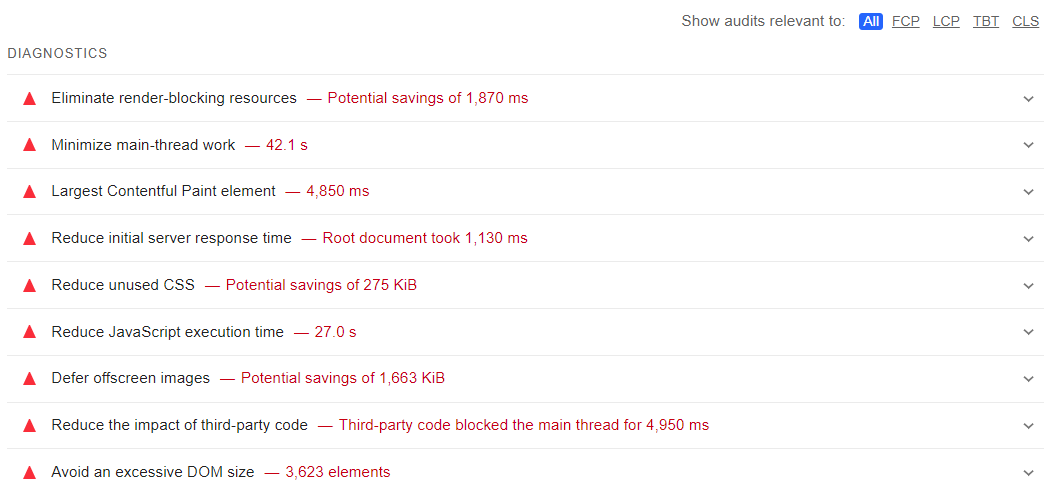
Are you wondering why a Google PSI test matters for you as a site owner? Is it necessary or optional to conduct tests? Well, it all depends on the speed at which your web page loads.
So, let’s explore how important website speed is for Google.
Why is Page Speed Important?
A slow-loading website is bad for your business.
You can consider your online shopping habits – do you wait patiently when a website takes forever to load? No, you don't. It's frustrating.
Similarly, customers will leave your website if it takes too long to load. And it’s true, a 2022 research study by Portent revealed that conversion rates drop depending on the website load speed.
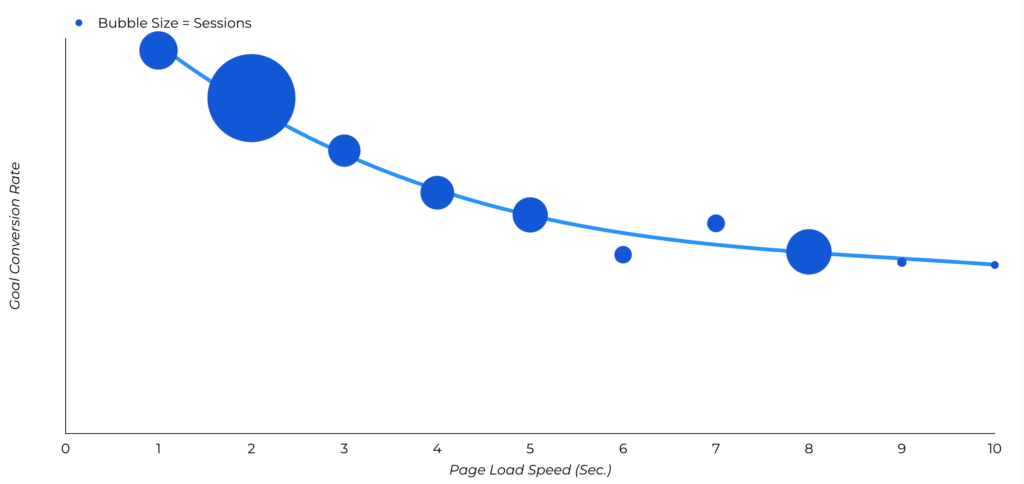
The primary reason is that the website fails to engage users promptly and keeps them waiting, provoking customers to leave and not return. This, in turn, impacts the conversion rate – a universal goal for any website.
Moreover, poor user experience is a big concern for Google. It has a substantial effect on core web vitals (the standards set by Google), directly influencing store SEO — another major concern for website owners aiming to rank on SERP.
So, consistently testing website speed and performance is necessary, and various tools can be used. However, Google’s PageSpeed Insights stands out for its high accuracy and ability to help you make data-driven decisions based on best practices suggested by Google itself.
Now that we have gained insights into what Google’s PageSpeed Insights is and why it matters for you as a website owner, let’s explore how to use this tool.
How to Use Google PageSpeed Insights?
Generating your speed report with PageSpeed Insights is one of the easiest tasks on earth, as Google has made this process as straightforward as possible. Let’s learn the steps.
Step 1: Visit the website of PageSpeed Insights.
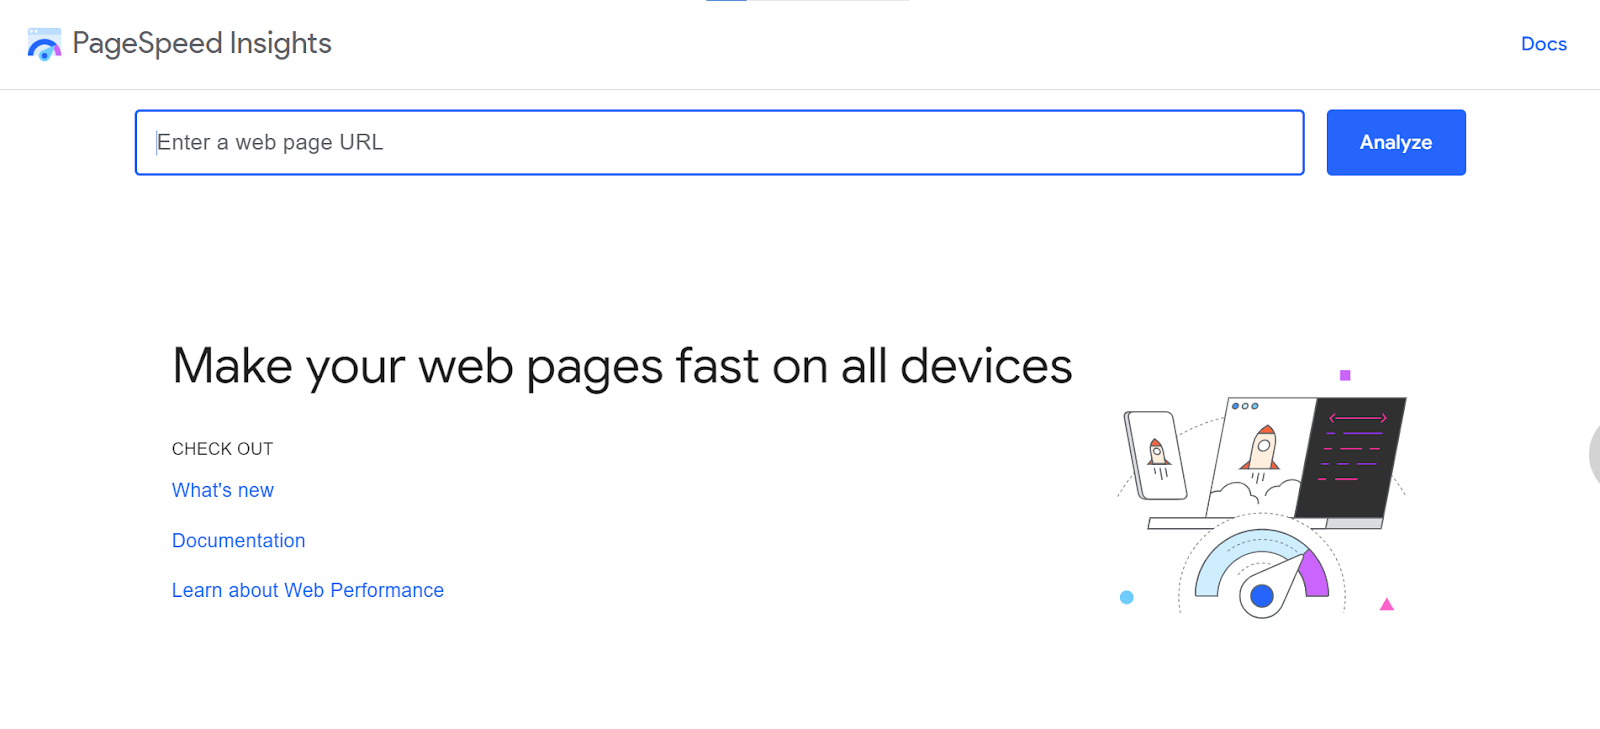
Step 2: Enter the URL of the website you want to check for the speed report.

Step 3: Click “Analyze” and let Page Speed Insights generate a report for the website.
Report generation may take a few seconds or minutes, depending on the complexity of your page and your internet connection speed. And here, you have your report.
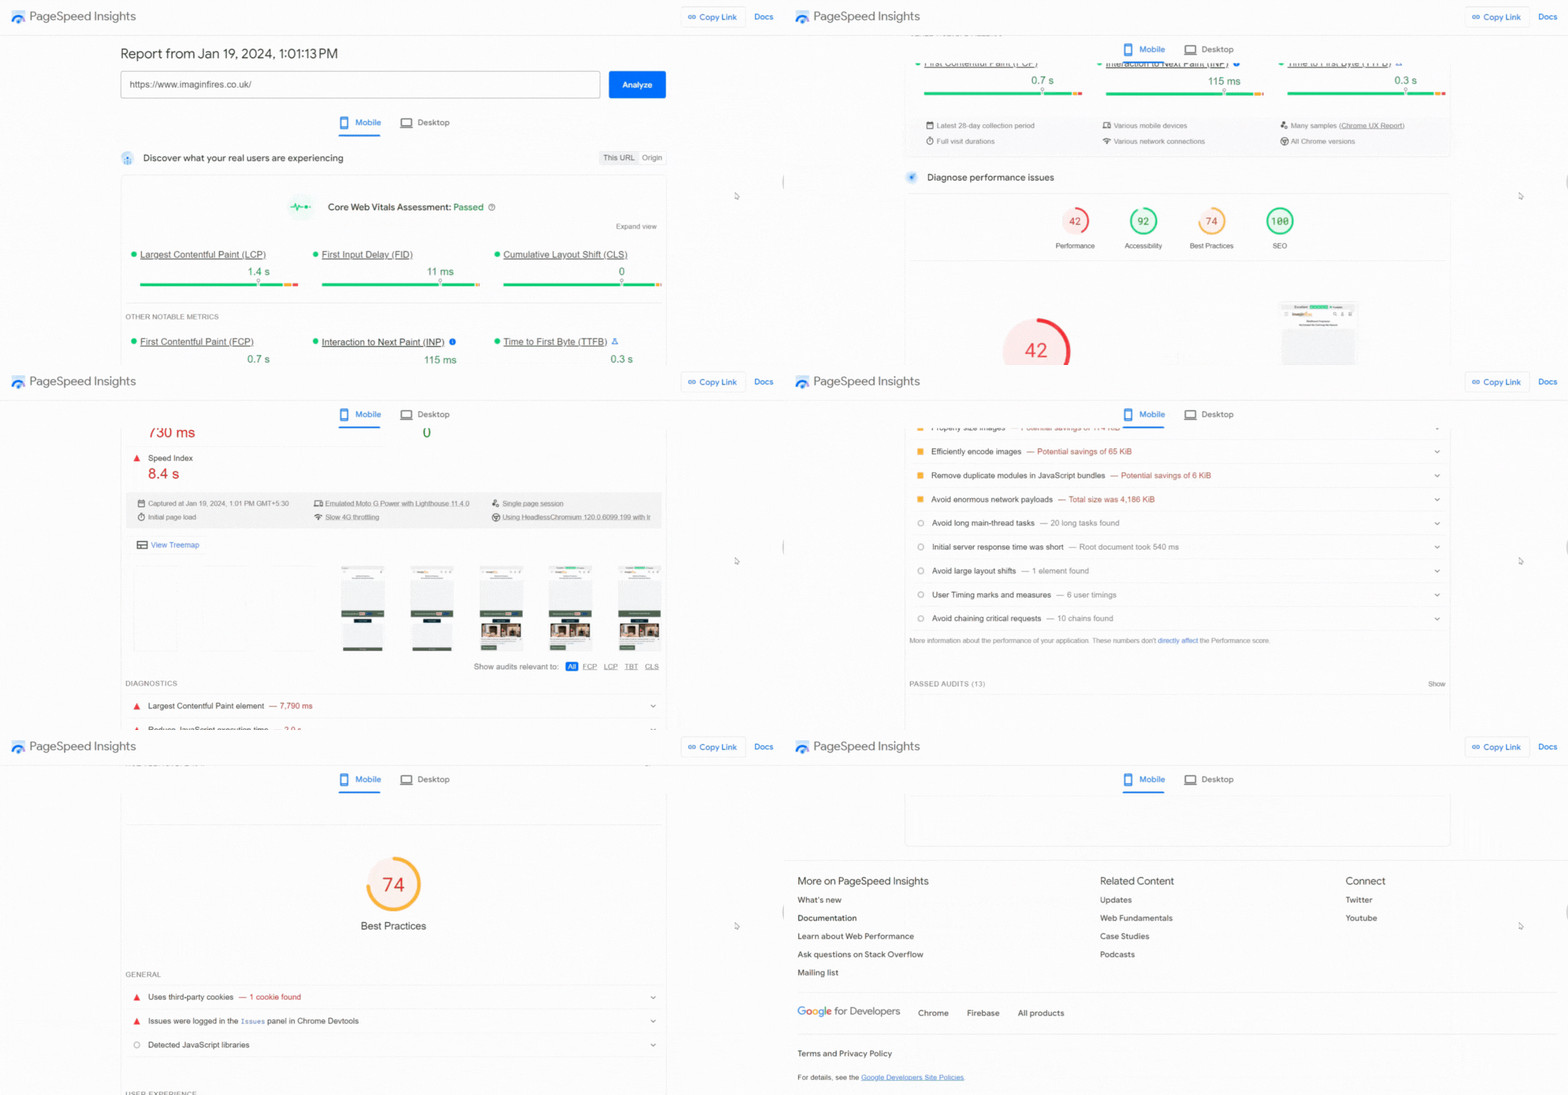
You might be wondering all these things mentioned in the report and how they come up with those speed numbers. Don't worry; we'll break down the entire report for you in the next section, making it all clear and simple to understand.
Google PageSpeed Insight Test Report Breakdown
When you carry out your website speed test with the PageSpeed Insights tool, you’ll be given a report that’s well color-coded to highlight areas that are performing well, those requiring improvement, and sections where the website is underperforming.
- 0 to 49 (red): Poor performance
- 50 to 89 (orange): Better performance
- 90 to 100 (green): Good performance
At the top of your PSI report, you'll have an option to switch and check the PageSpeed report specific to mobile and desktop devices.

When you switch between reports, you’ll observe a lower score on mobile PageSpeed Insights compared to the desktop version, and this is completely normal.
There are various reasons for that to happen, such as:
- Mobile devices often operate on slower processors.
- Mobile devices have different CSS rules for arranging elements on smaller screens.
Let’s come down to the main PSI report, you can observe that the report is divided into two sections:
- Field Data - Core Web Vital Assessment
- Lab Data - The 100/100 Scores with Opportunities and Diagnostics
While everything is well-structured, for a non-technical person, it may be confusing to understand all these elements in-depth. So, here, we’ll break down each component of this report to understand what it means.
Let’s start with the first section of the report: the field data.
Field Data - Core Web Vital Assessment
Below, you see a section that shares real-user information (field data) for core web vital assessment. I've pointed out each element in this section; let's understand what they talk about.
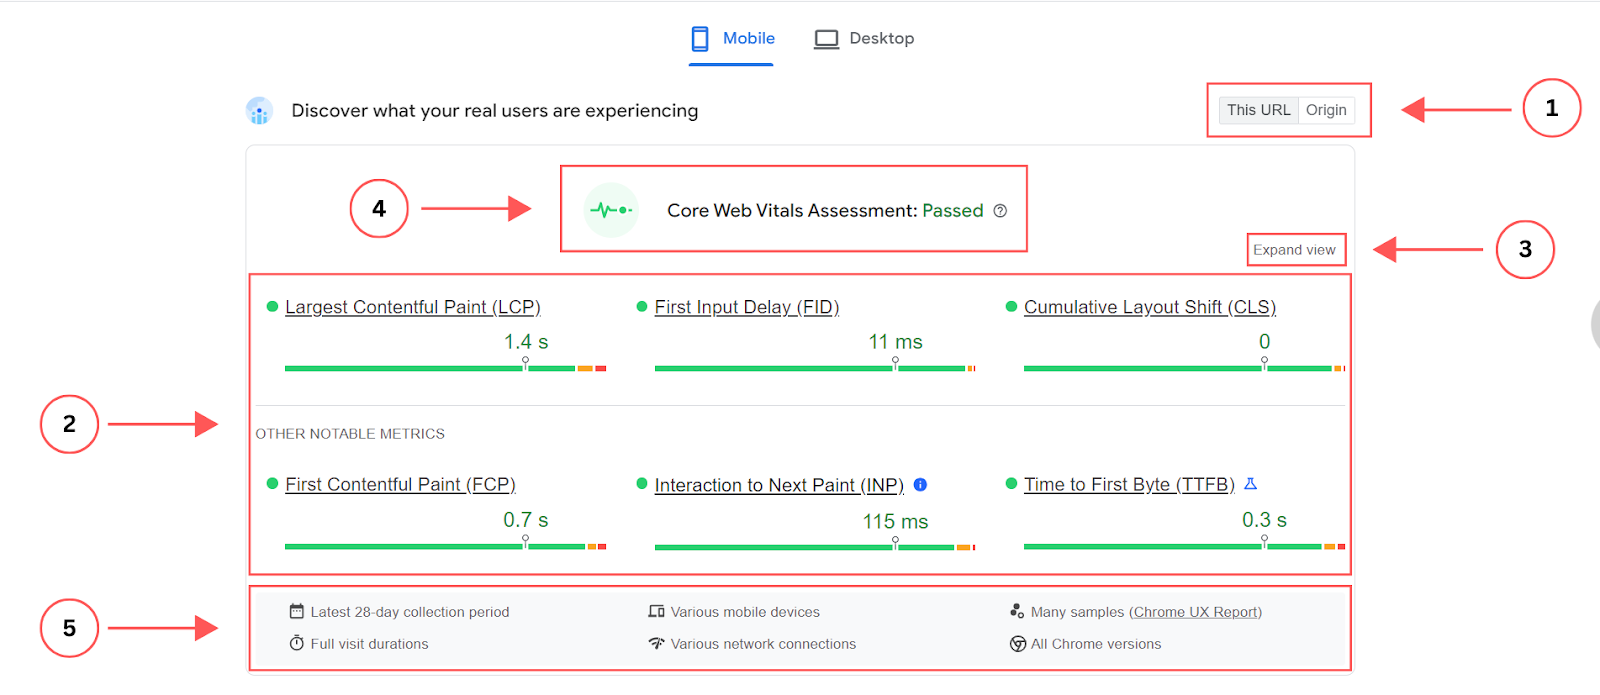
1. This URL / Origin
First, you see a button named “This URL / Origin”, allowing you to switch between core web vital results specific to the URL you entered ('This URL') and results for the entire domain ('Origin').
2. Core Web Vitals Report
Google cares about what users experience on your website, and they measure it using these core web vitals.
So, once you obtain data for the URL or the domain, the second element you see is the Core Web Vitals report based on real-world data captured by the CrUX database. This report provides insights into how well your web page or website is performing for each of Google's Core Web Vitals.
Let me share a basic overview of each Core Web Vital that the PSI report will contain information about.
- Largest Contentful Paint (LCP): Measures how quickly the largest content on a page fully appears.
- First Input Delay (FID): Measures the time delay between the first user interaction and the page response.
- Cumulative Layout Shift (CLS): Measures page layout stability during load time.
- First Contentful Paint (FCP): Measures the time between page load and the first visual element.
- Time to First Byte (TTFB): Measures the time delay for creating a connection to the server and downloading the web page contents.
- Interaction to Next Paint (INP): Measures the time delay between user interactions and page response.
(NOTE: INP is a pending Core Web Vital that is supposed to replace one of the Core Web Vitals, named FID, starting from March 2024. Learn more about INP.)
You can check the colors and numbers to understand where your website is doing good, and where it can be improved.
3. Expand View
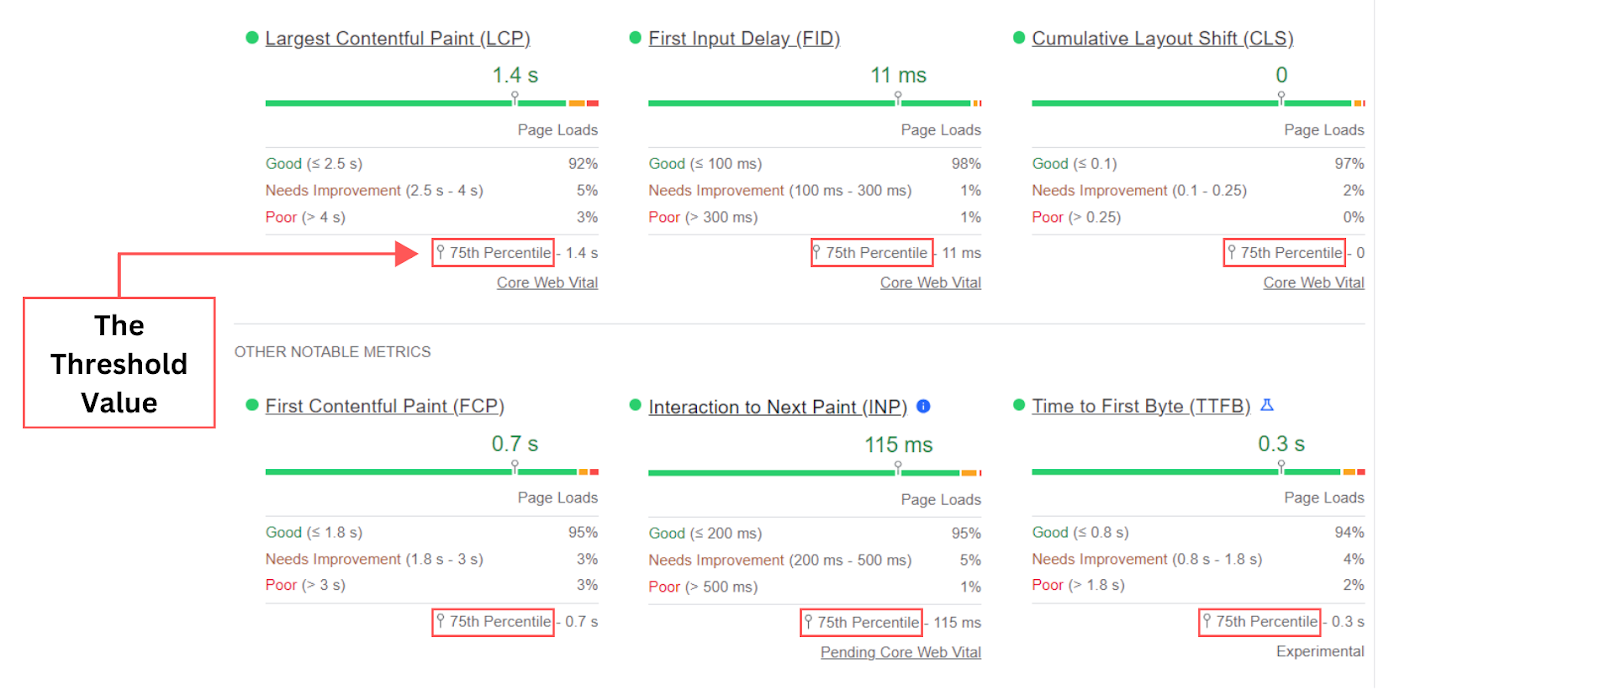
To better understand these Core Web Vitals, use the 'Expand View' option at the top right corner.
When you do that, you'll see a detailed breakdown of each metric, displaying the percentage that is supposed to match or be above the threshold value suggested by Google.
If the percentage falls below the set threshold, it might indicate there's room for improvement.
4. Report Status
In the Pagespeed Insights field data section, the report status, indicates whether your Core Web Vitals assessment has passed or failed.
If all your core web vital assessment numbers are meeting or above the specified threshold values, the status will be marked as 'Passed.' However, if even a single one doesn't meet the required standard, the status will be 'Failed,' asking for further improvements.
5. Data Source
In the field data section, there is an information panel that reveals where the Core Web Vitals assessment data came from.
It states that the information presented is extracted from the CrUX database and is based on web user experiences from the last 28 days, involving various devices and network connections. Along with that, it offers an option to view the entire field data report captured by CrUX.

6. No data found
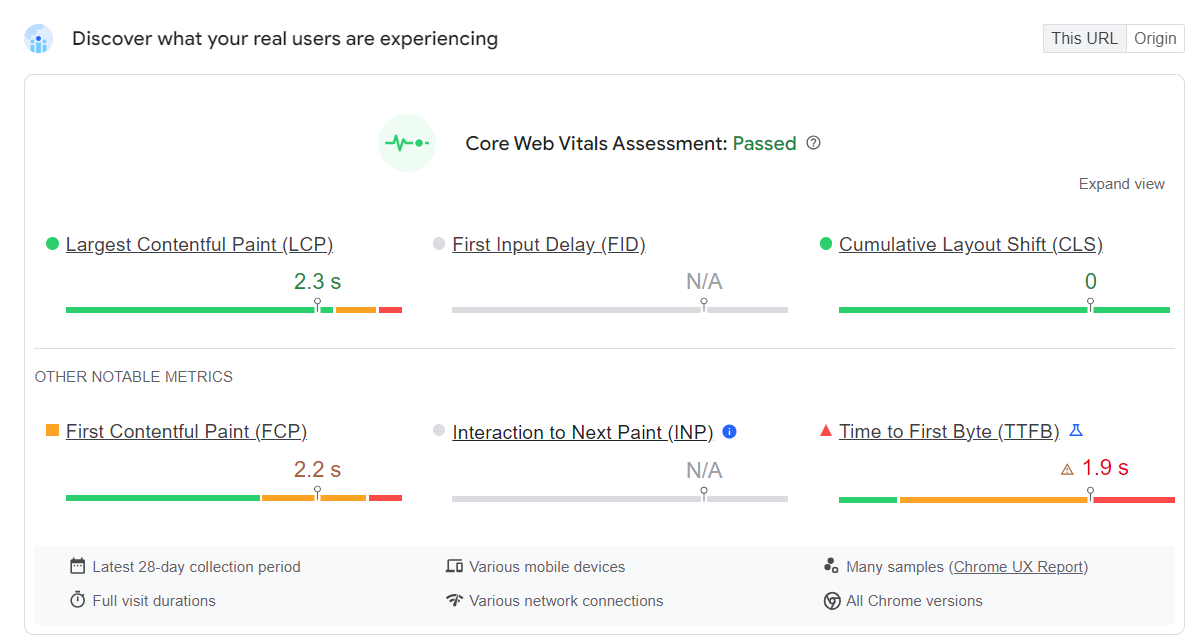
Sometimes, for websites with lesser traffic, CrUX tends to have less or no data. In this case, you can obtain the field data in the Origin tab, which will cover data for pages across the domain, but still be insightful.
If you don’t find data in the Origin tab either, you can proceed with the lab data results.
So, let’s move to understanding the lab data section of the PSI report and comprehend those performance scores given out of 100.
Lab Data - The 100/100 Scores with Opportunities and Diagnostics
Once you go through the field data, the next section provides performance scores based on lab data—an artificial test conducted within a controlled environment, using predefined device and network settings—along with suggestions on improving that score.
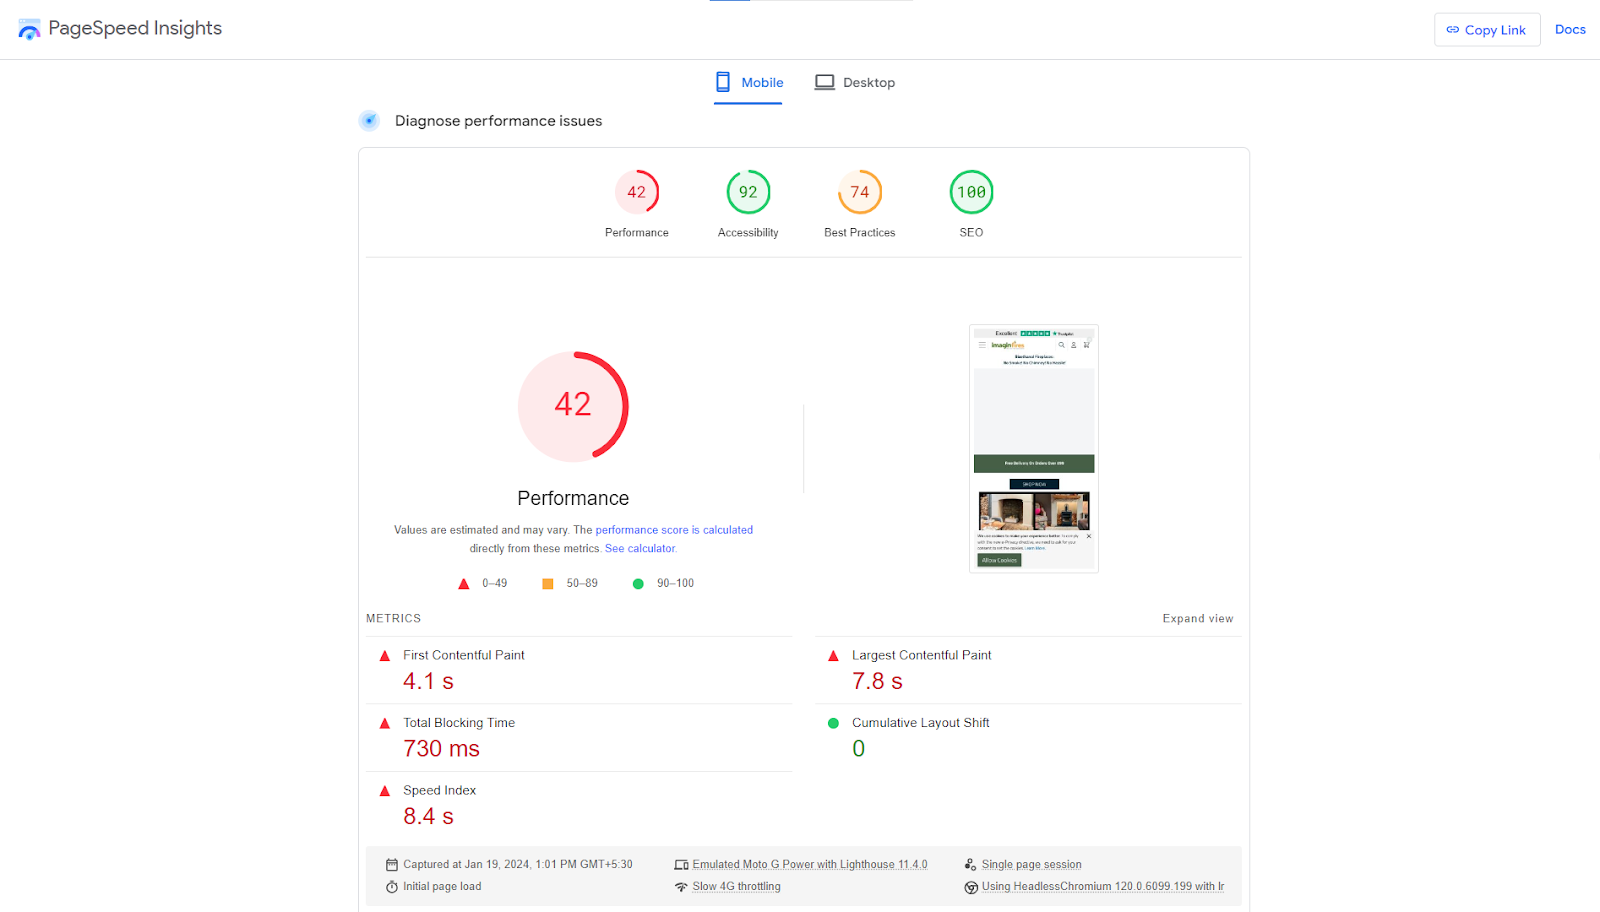
These data are extracted from Lighthouse and, although they don't capture real-world bottlenecks, they provide valuable insights into understanding how the website performs.
Depending on all the data collected from Lighthouse, Google PageSpeed Insights gives your page a score for each of the following categories: Performance, Accessibility, Best Practices, and SEO.

Let’s gain more knowledge on each of these scoring categories.
1. Performance
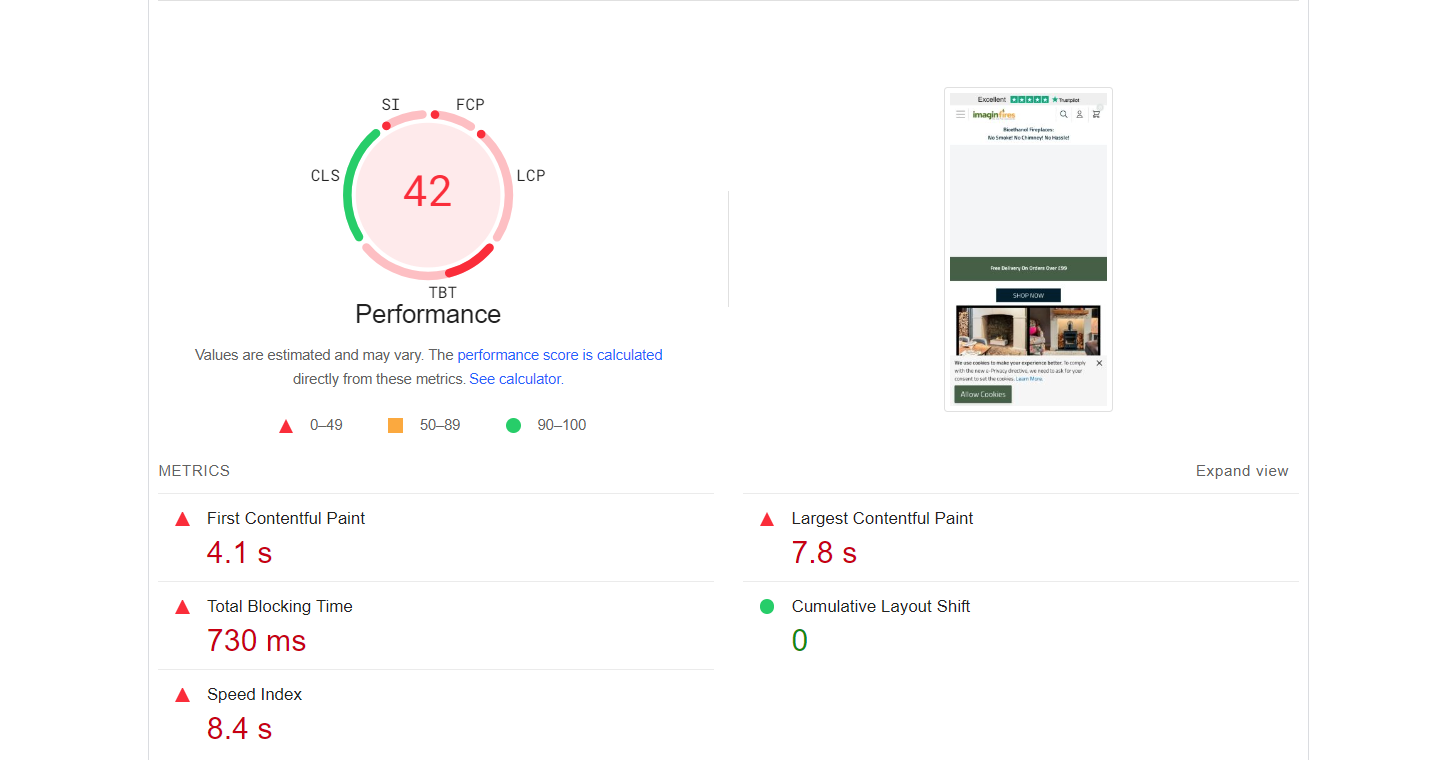
Here, the performance score is obtained by analyzing lab data for core web vitals. When it comes to calculating the performance score out of 100, each of the metrics has its weightage.
This table shares the weightage considered for each metric.
This overall score for performance indicates how well your website is optimized for speed. Moreover, you can compare these performance numbers with field data for core web vital assessment and have a better idea of web performance.
When you scroll down a little, you’ll see diagnostics and improvement areas relevant to each of the metrics that the performance category considers.
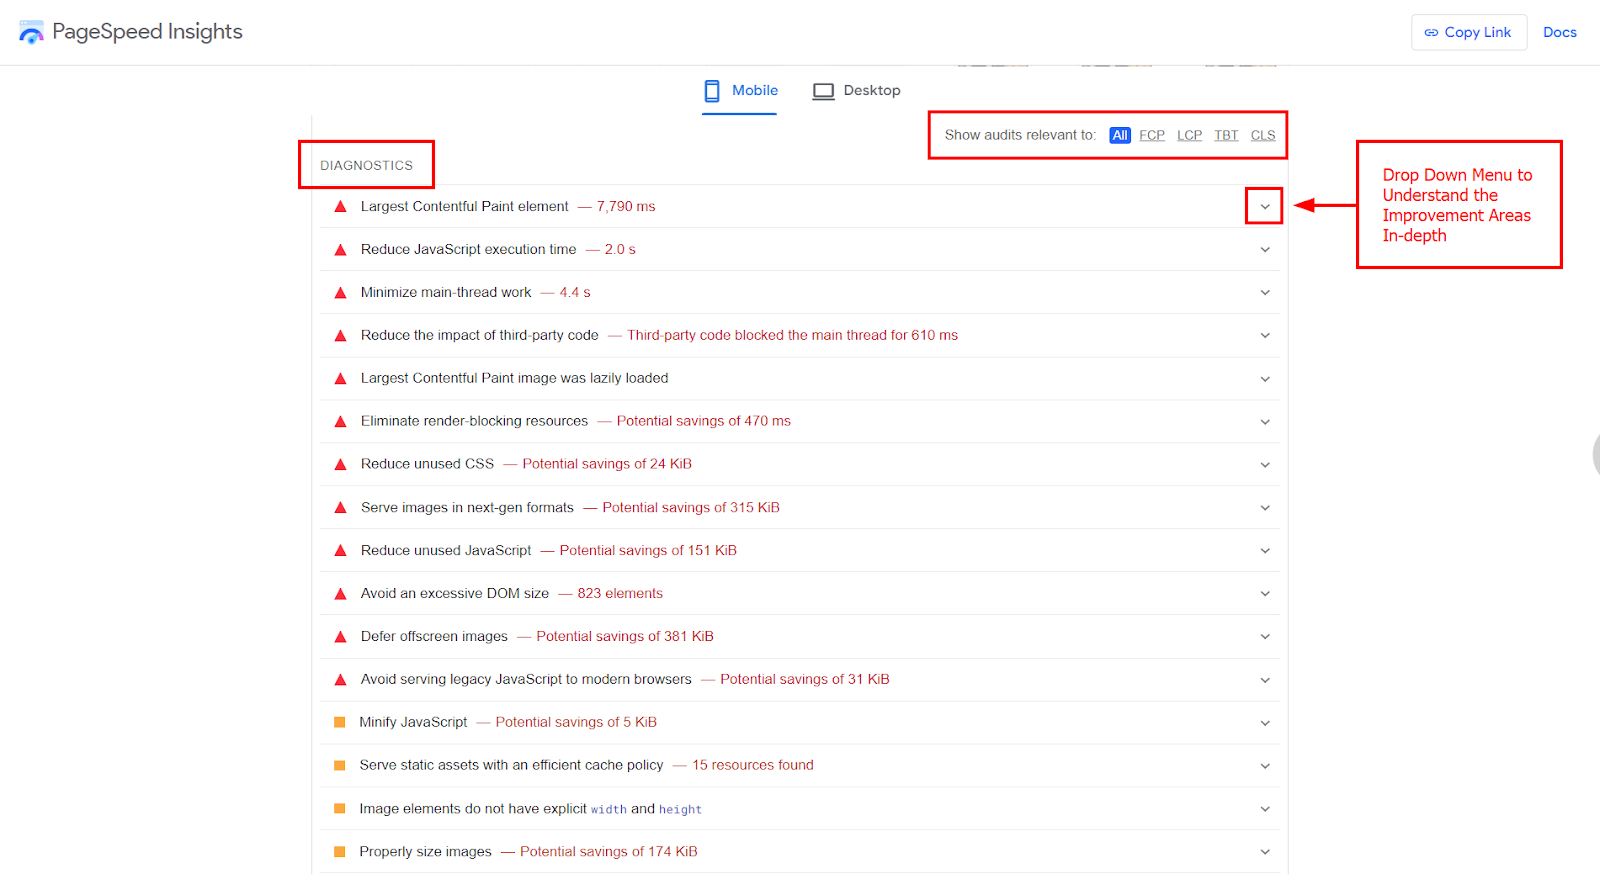
You can use the drop-down menu to understand them well.
It’s better to note that these recommendations are coming straight from Google to help you improve your website performance, further helping you enhance your performance score.
2. Accessibility
The Accessibility element evaluates how easily users can access and navigate your website, with a focus on user-friendliness. The accessibility score is calculated from an analysis of several factors such as website navigation, color contrast for users with visual impairments, alt text for images, and more.
Upon clicking on the accessibility score allotted, you’ll be taken to a detailed section that shares insights into areas that can be taken care of to improve your accessibility score.
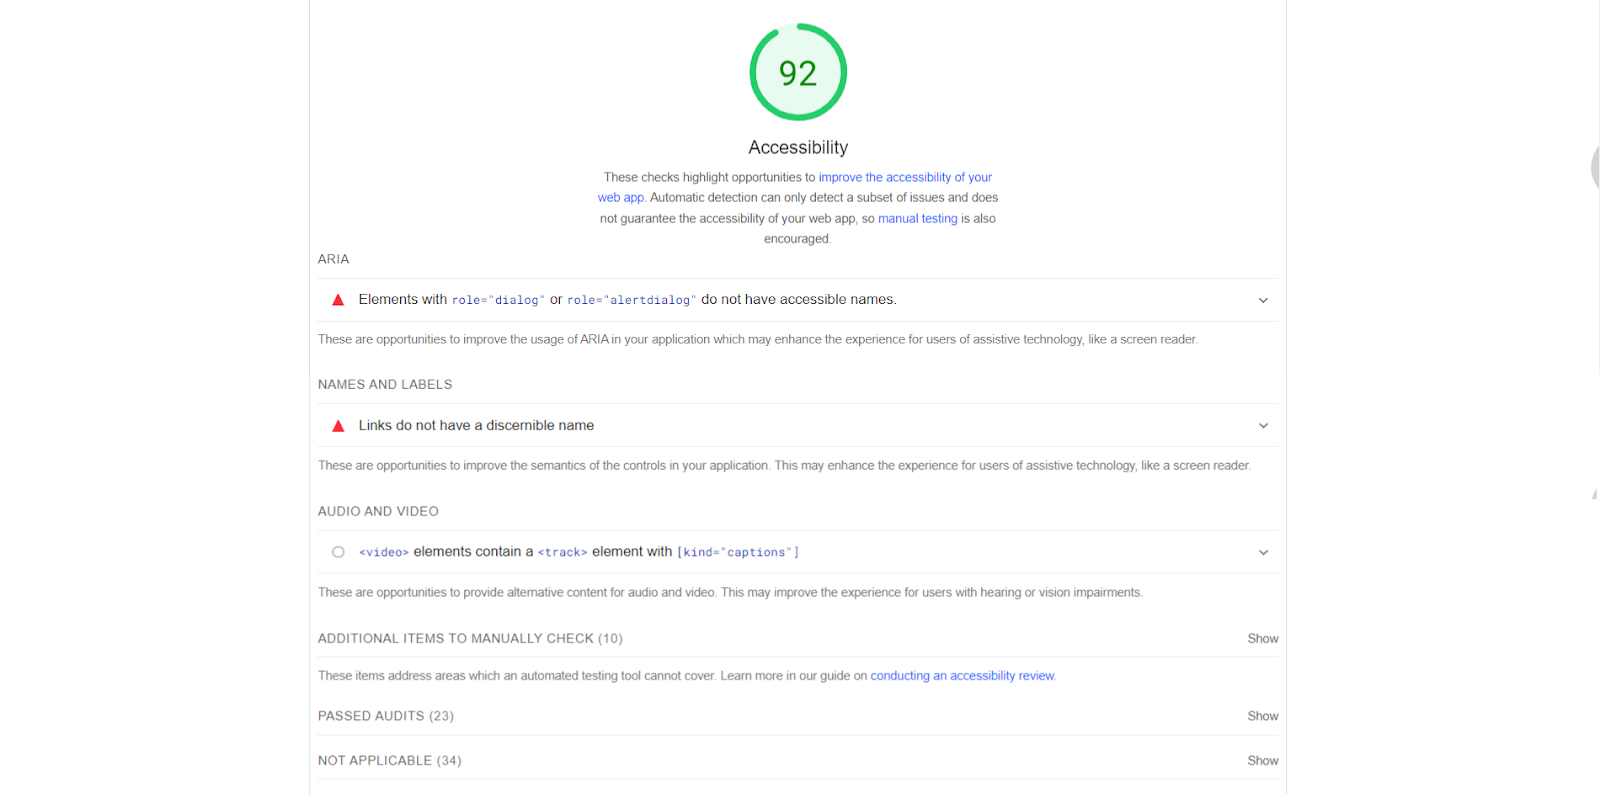
By considering these suggestions for the accessibility element in the PageSpeed Insights report you can enhance the overall accessibility of your website, making your website more user-friendly and inclusive for a diverse audience.
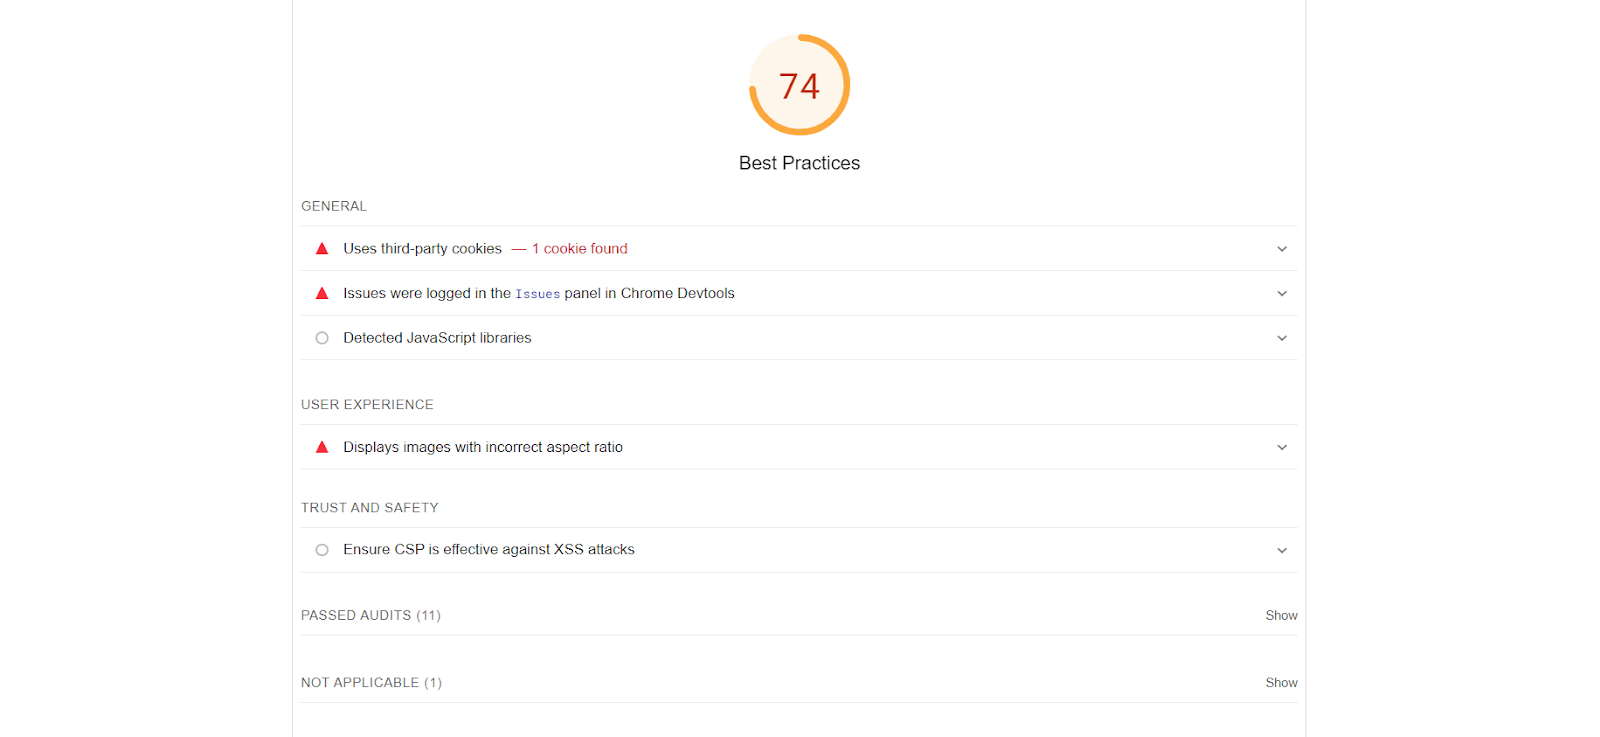
3. Best Practices
The 'Best Practices' element in the PageSpeed Insights report indicates how well the website follows recommended web development practices and standards.
This considers factors such as using modern web technologies, optimized code, secure connections, mobile-friendly design, and more to ensure the website follows industry best practices for performance, security, and user experience.
Moreover, if you click on the score given, you'll see a detailed section that gives tips on how to make your website meet Google's standards.
4. SEO
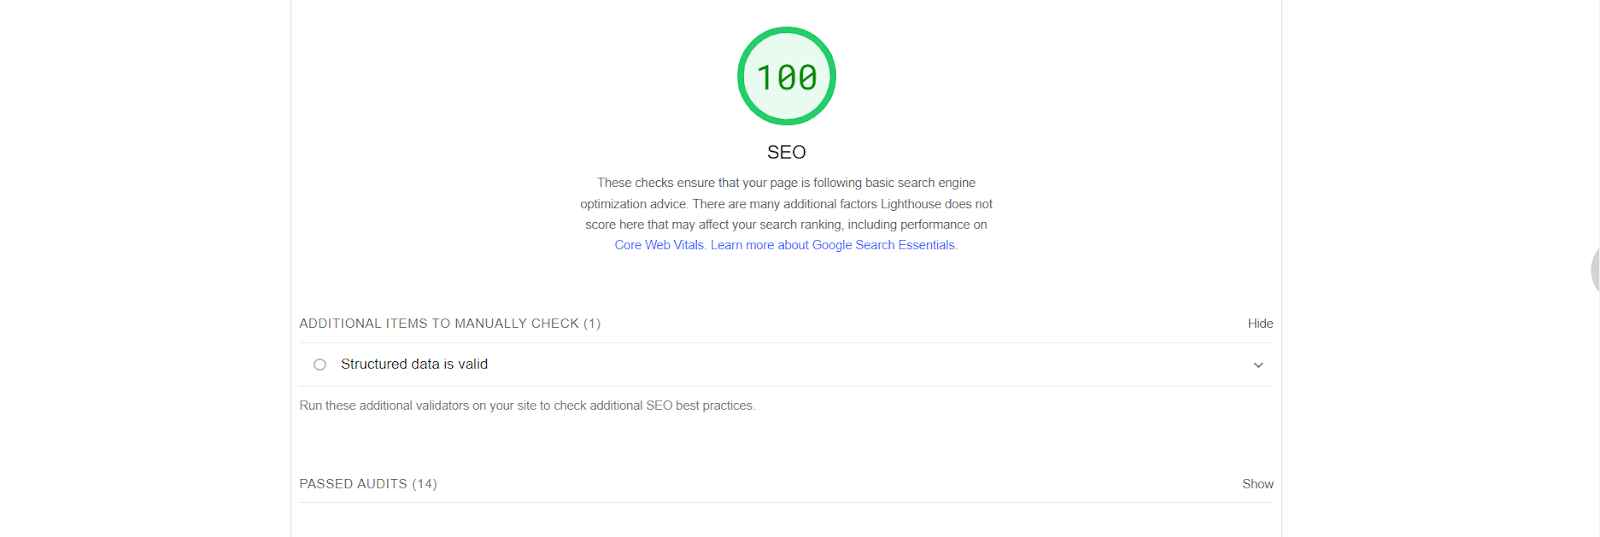
Lastly, PageSpeed Insights provides a score based on how SEO-friendly the website is.
For that, PSI considers metadata, data structures, mobile-friendliness, and more that play crucial roles in optimizing a website's visibility on search engines. Similar to the ‘accessibility’ and ‘best practices’ elements, you can discover opportunities for improvement by clicking on the score given for website SEO.
5. Treemap
Under all the lab test details and the scores given for each category, you’ll see a button named “View Treemap”.

Now, what’s treemap?
The Treemap represents the performance of page elements during loading. Clicking the 'View Treemap' button takes you to a new tab where information is presented in the form of rectangles of different sizes and colors.
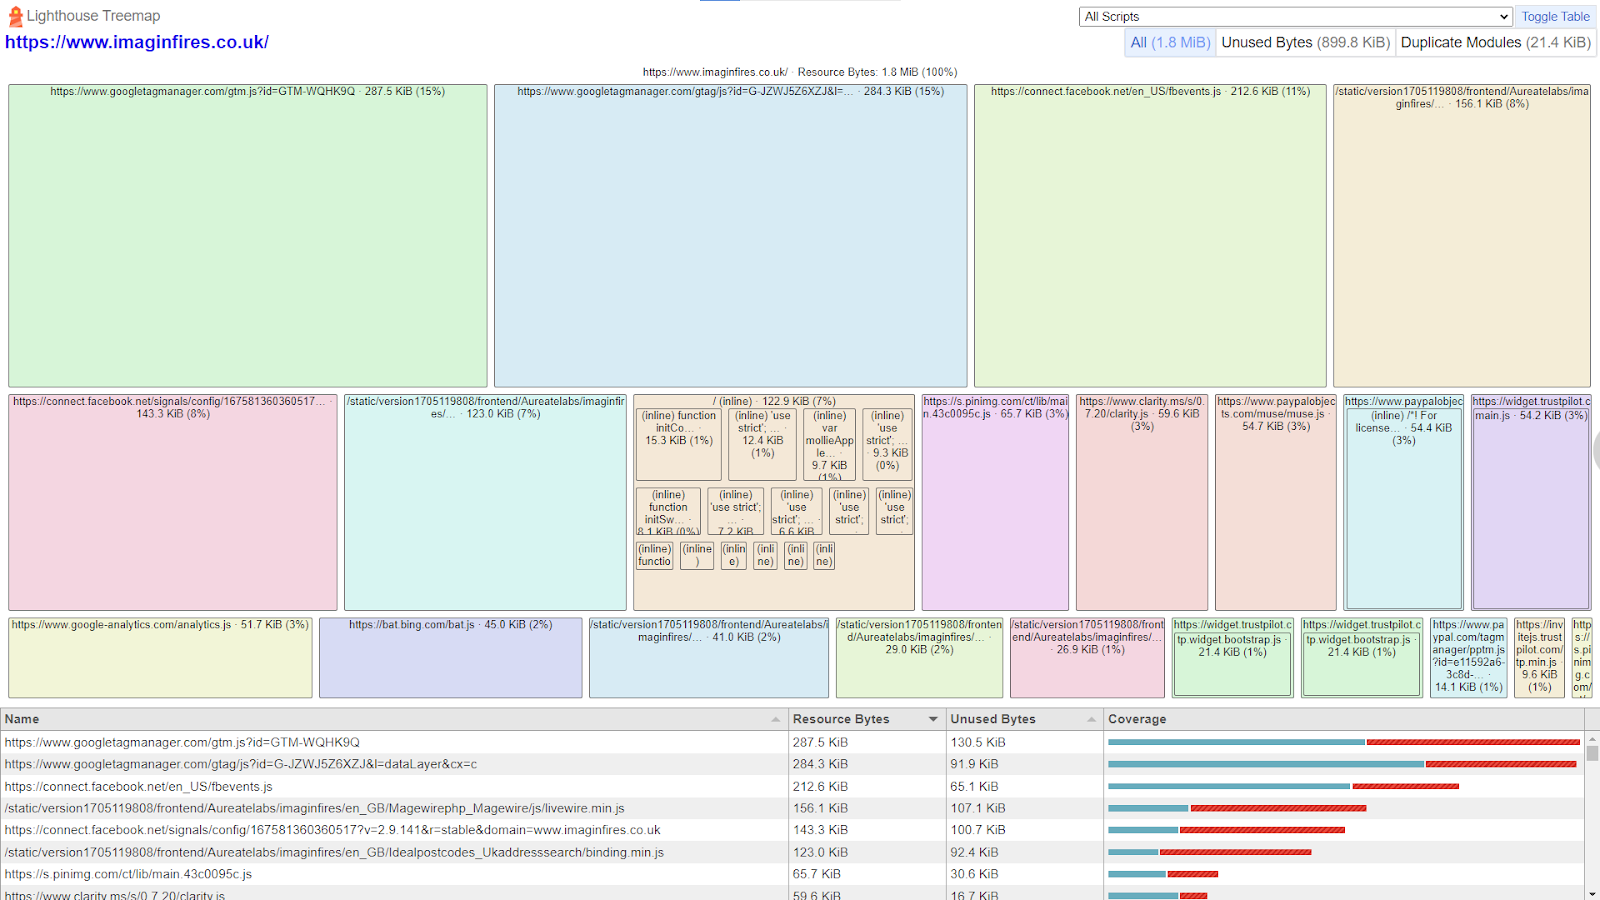
Each rectangle represents resources (such as JavaScript, CSS, images, fonts, and more), with each rectangle's size indicating the 'file size' of resources on the web page — larger rectangle sizes correspond to larger file sizes.
The goal is to identify large blocks, and reduce their file sizes, as they represent resources that might impact your page's load time. One way to achieve this is by removing unused bytes.
In the report, you can find an option to check the amount of 'Unused Bytes' per resource, placed in the top right corner.
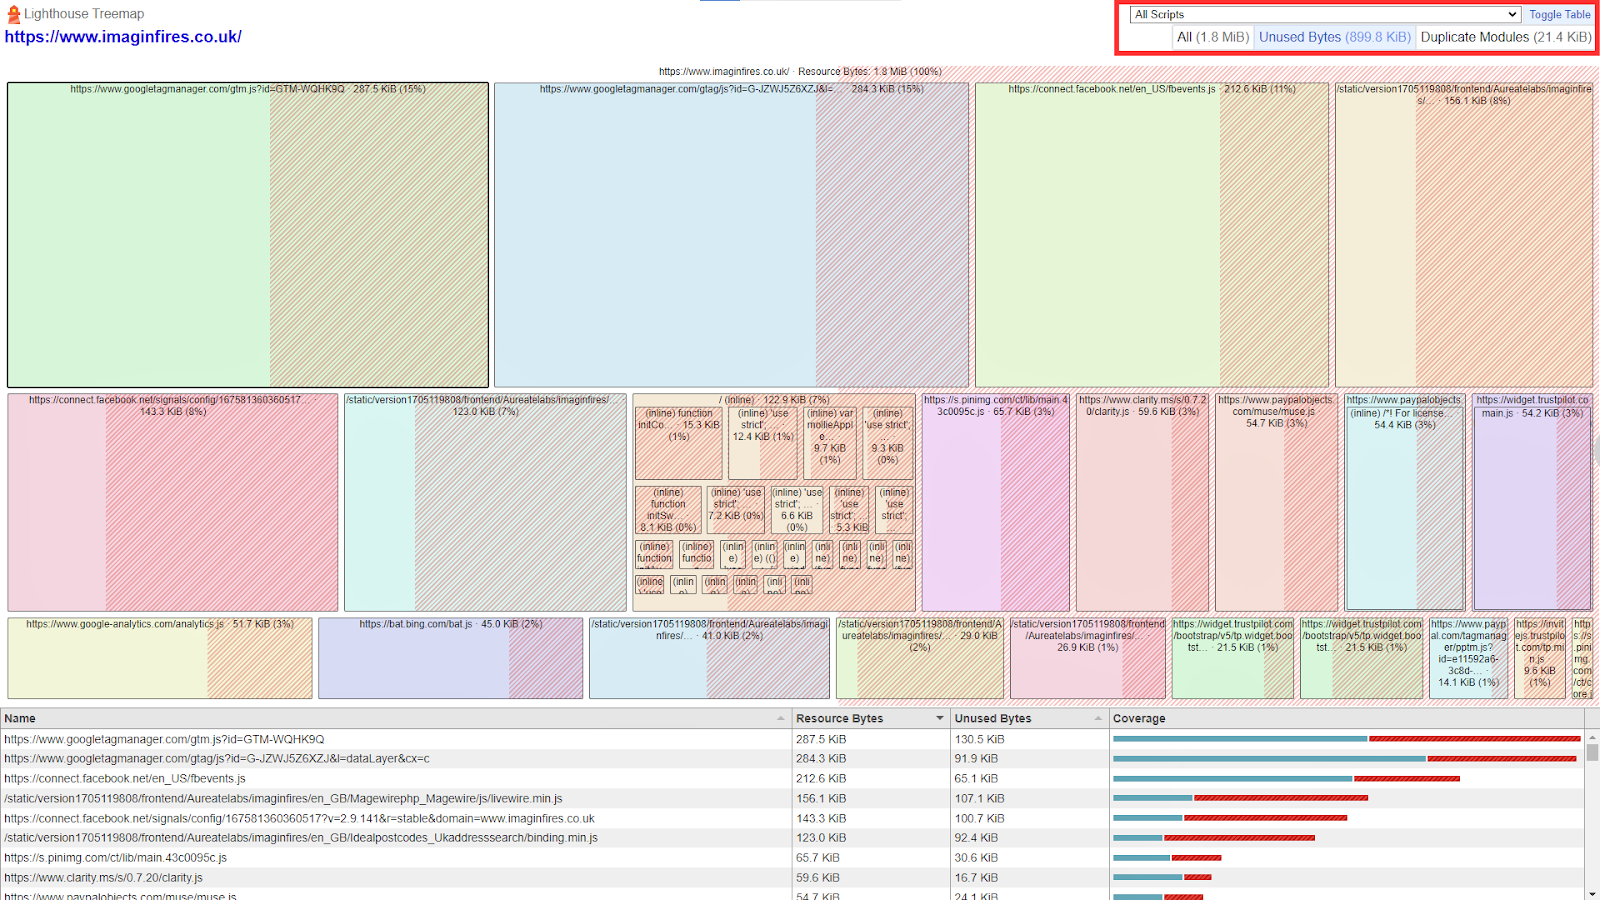
This chunk of the report typically displays the amount of data within your web page's resources that is downloaded but not utilized for any user interaction.
Now, this presents an opportunity for you to reduce the file size for these resources by removing unnecessary JS and CSS elements, optimizing or lazy-loading images, and only including files that are essential for your site's functionality.
Such targeted improvements will positively impact overall performance.
Note: It’s suggested to take professional help while considering optimizing any technical area.
7. Passed Audits
Alongside the lab data and opportunities for score improvement, you'll find 'Passed Audits' in the report.
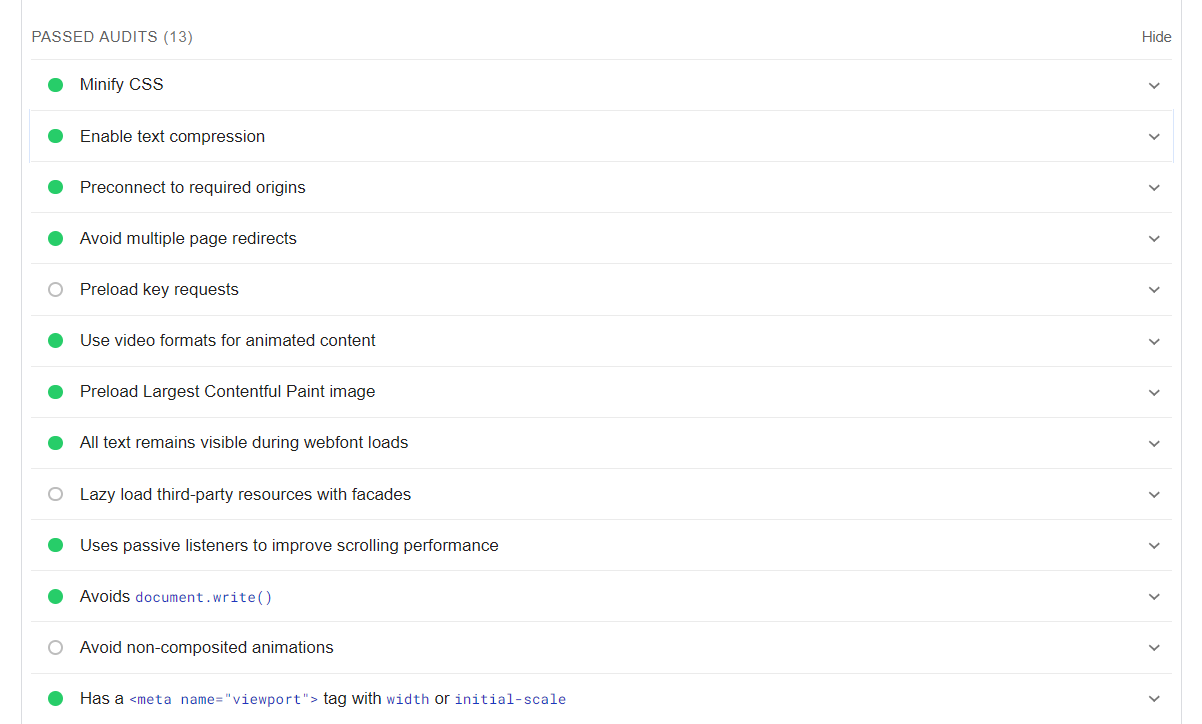
These passed audits signify that your website has performed well in meeting established standards by Google, highlighting areas contributing to faster page loading. This insight allows you to consistently optimize these areas, ensuring ongoing positive performance.
6. Data Source
Lastly, you see a small panel showing how the lab data was captured.

It includes the timestamp indicating when the report was generated. Additionally, the panel specifies that the report data is extracted from Lighthouse and provides information specific to the initial page load.
Furthermore, it shares details about the type of network connection and the system used for generating the report. This transparency helps you understand the conditions under which the lab data was collected, facilitating informed decisions for performance optimization.
And that concludes our discussion on the lab data present in the PSI report.
Along with that, our exploration of the PageSpeed Insights report ends here. I hope you now have a clear understanding of what each element in this report signifies.
Now, understanding everything about PSI must have sparked your interest in achieving a nice speed score. So, let’s continue our discussion by uncovering top performance recommendations coming straight from Google.
9 PSI Performance Recommendations for Better Web Performance
Getting a perfect 100% on PageSpeed Insights isn’t an overnight task; it will require hours of hard work. It may be tiresome, but you need to top those SERP rankings, organic traffic, and conversions.
So, here are some tips to speed up your website and improve your speed score suggested by Google itself.
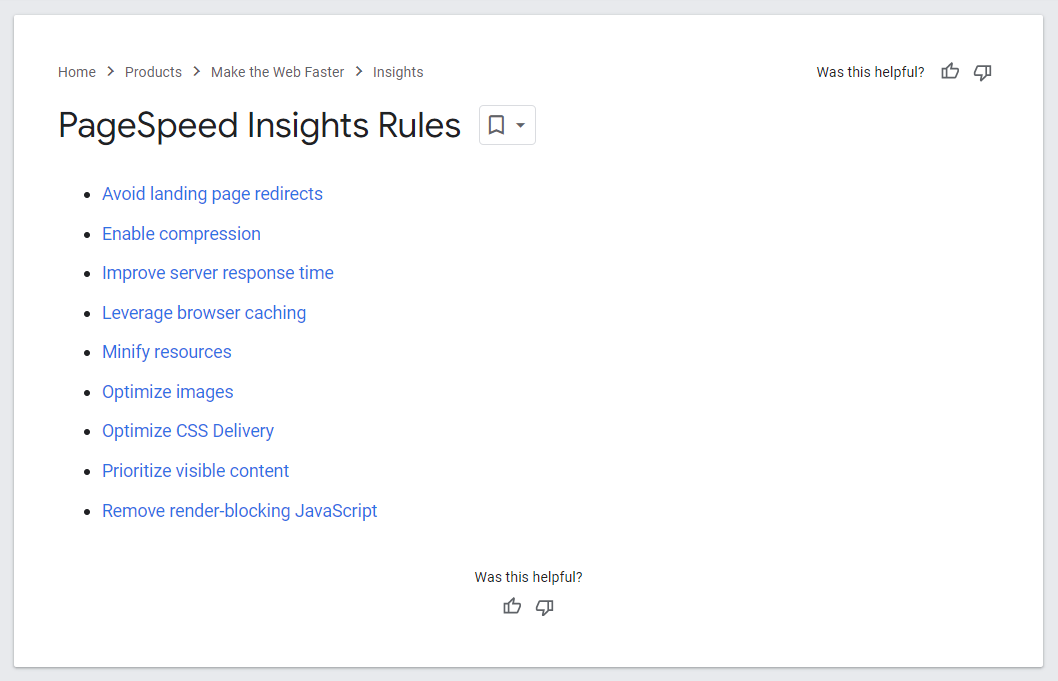
Let’s understand how it helps.
1. Avoid Landing Page Redirects
Landing pages are meant to be fast and direct, having too many redirects on your landing page is not a good idea. Multiple redirects will send users on longer journey that may bore them before reaching the final destination, conversion.
So, avouiding the redirects on landing page helps you make sure your visitors get to your content faster and without unnecessary delays.
2. Enable Compression
The biggest reason for your slow web pages and lower speed scores are larger files.
When you have smaller files on your web page, it becomes easier for server to transmitte them faster, improving overall site speed and user experience.
3. Improve Server Response Time
Server response time has big hand in web page load times.
The quicker your server accepts and processes user requests, the faster your users will receive results, and the quicker your web page will load. Moreover, the server response time will also depend on how efficient your backend is, such as whether it serves up quickly when someone requests a page.
Let me share how long a server should take to present users with feedback.
- Excellent: Under 100ms.
- Good: Between 100ms and 200ms.
- Acceptable: Between 200ms and 1 second, but improvement is recommended.
- Too slow: Server response time above 1 second; reducing response times is necessary.
4. Leverage Browser Caching
Browser caching is like saving previously-loaded web page elements in browser's memory.
When you turn on browser caching, user visits to different web pages on your site will become more efficient. Elements such as logos and footers won't need to reload, as everthing is already loaded from the first user visit, helping the web page load faster.
5. Minify Resources
Minifying resources is the process of removing all unnecessary characters from code without altering its functionality. This is a necessary step to take, as smaller files load faster, optimizing the performance of your web pages.
You can consider removing whitespace, comments, and semicolons, along with the use of shorter variable names and functions to offer visitors a top-notch experience.
6. Optimize Images and Videos
Images and videos present on a web page makes it harder for server to process and display the results quickly. Therefore, it's highly necessary to optimize all visual content on the web page, especially images and videos.
You can consider compressing their file sizes to an extent that doesn't compromise quality. This ensures that your visuals load quickly, keeping your users engaged from the first glance.
7. Optimize CSS Delivery
CSS scripts play a significant role in presentation delay.
If they are poorly delivered, the browser may need to wait to download and process the page styling data before displaying it to users – extending the page load times.
To optimize this, you can consider combining CSS scripts and reducing the number of requests the browser needs to make. Fewer requests mean quicker load times, resulting in a smoother and more responsive user experience. Moreover, you can also compress the CSS files to let the web page load quickly.
8. Prioritize Visible Content
Visible content means the content above-the-fold content, that users first see on the website without scrolling down, before any other elements on the page.
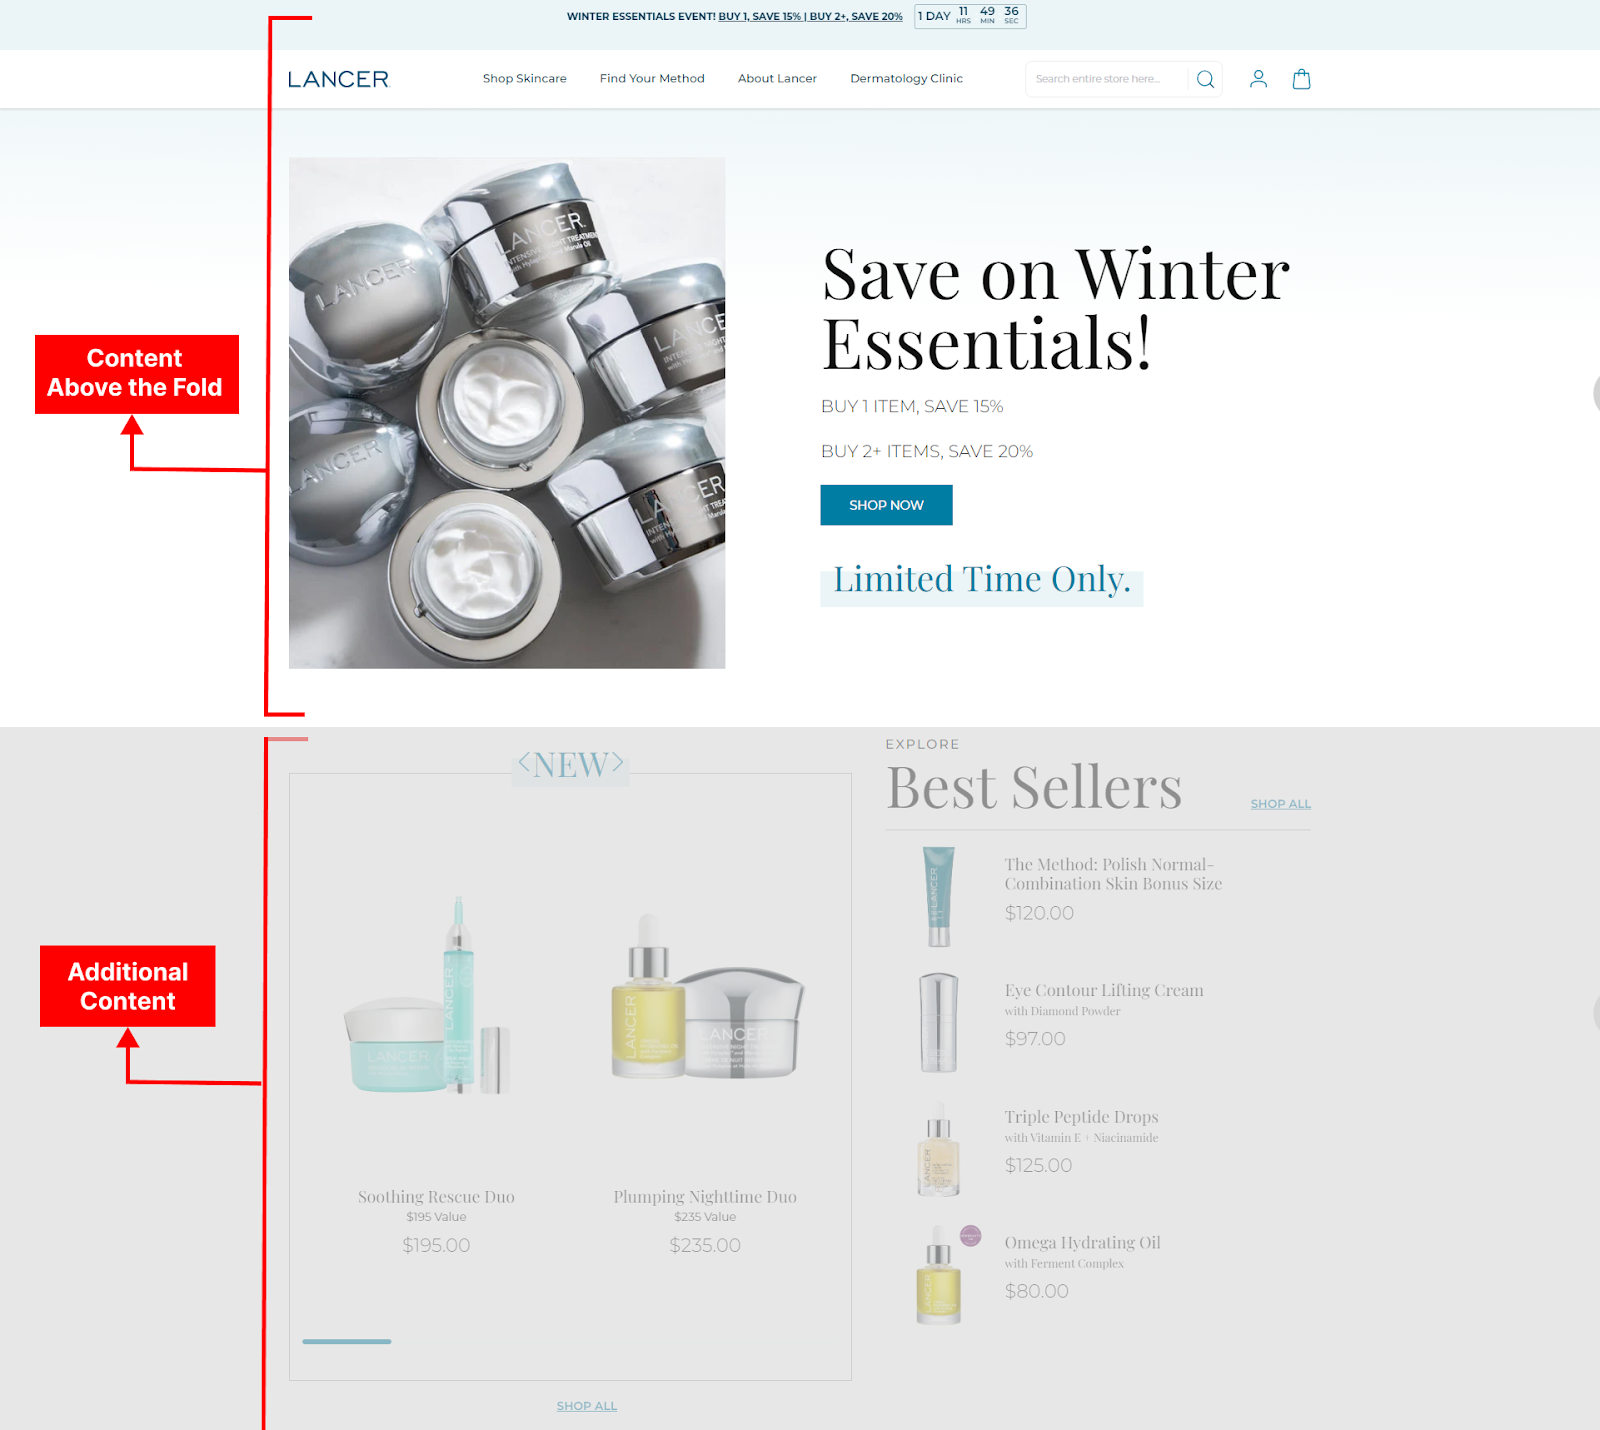
Here, Loading critical content first, before additional content, helps to hook customers by presenting important information quickly.
9. Remove Render-blocking Javascript
When a user makes a request on your web page, browsers load a large number of resources to share results, such as CSS files or images. If a resource is render-blocking, the browser doesn't start showing page content until that resource has finished loading.
JavaScript is the director of a play; it needs to show up quickly. Now, to reduce load times, it becomes necessary to remove render-blocking for JavaScript. This will allow the page to load while the scripts do their job in the background, ensuring smooth performance and keeping your users engaged without unnecessary pauses.
So, here, we've discussed the top suggestions that help you increase your speed scores.
Other than these, you can focus on basic aspects such as choosing a faster website theme, optimizing the design for mobile devices, minimizing the file size of JS and CSS, reducing the impact or usage of third-party code, and more.
However, you might wonder whether it is necessary to achieve a perfect 100/100 score on the PageSpeed test, or if having a slightly lower score is acceptable. Additionally, you may want to understand the negative consequences of having a poor speed score.
Let's explore answers to it.
Is 100/100 PageSpeed Score Necessary?
Many website owners and developers are obsessed with achieving a perfect 100/100 score on PageSpeed Insights, considering it an indicator of excellent website performance.
However, obtaining a flawless score may not always be practical for certain types of websites.
When it comes to performance optimization, various factors, including business goals, resource constraints, and specific website needs, must be taken into account. All these factors may not always align with the standards considered by the tool, making it challenging to obtain a good score without making aggressive optimizations – which again has a bad impact on user experience.
I'm not suggesting that optimizing speed scores is unnecessary; it is indeed crucial. Otherwise, negative consequences may arise, such as:
- Poor User Experience
- Decreased Search Engine Ranking
- Mobile Accessibility Issues
- Reduced Conversions
So, instead of chasing after a perfect score, the recommendation is to find a sweet spot where your website achieves a good balance between performance and other considerations.
In short, The goal is to optimize your website sufficiently to provide an excellent user experience without over-optimizing and disrupting website operations.
Let’s end this conversation with some FAQs related to PageSpeed Insights.
FAQs about Google PageSpeed Insights
1. Is Google PageSpeed Insights free?
Yes, Google PageSpeed Insights is a free tool that helps find and fix issues slowing down your website. This data is extracted from tools named Lighthouse and the CrUX database, which are a combination of real-world data and lab data.
2. How do you score a perfect 100% on Google PageSpeed insights?
Achieving a perfect 100% score on Google PageSpeed Insights can be challenging, but here are some strategies to improve your PSI score.
- Optimize Images & Videos
- Minimize Server Response Time
- Leverage Browser Caching
- Minify CSS, JavaScript, and HTML
- Eliminate Render-Blocking Resources
- Prioritize Above-the-Fold Content
- Reduce Server Requests
3. Is Google PageSpeed Insights Reliable and Accurate?
Yes, Google’s PageSpeed Insights is reliable and accurate for measuring overall user expeirence on websites. It shares a clear view to how users interact with your site and also suggests useful recommendations for optimization.
4. Does PageSpeed Insights affect SEO?
Yes, Google PageSpeed Insights can have an impact on SEO. Page speed is one of the factors that Google considers when ranking websites in search results. Faster-loading pages generally provide a better user experience, and Google aims to prioritize websites that offer a positive experience for users.
Final Words on Google's PSI
PageSpeed Insights works like magic to understand and improve your website performance through various measures, helping you optimize your site for better SERP rankings or providing a better user experience.
It is an easy-to-use tool, and I hope this guide has provided enough information for you to conduct speed test with the PageSpeed Insights tool. If you have any remaining doubts, feel free to comment below; we are pleased to help you.
Lastly, we are Mini Store, offering SEO-friendly and conversion-ready templates. If you want to skip the hassle of performance optimization, get Mini Store today and avail your free trial.
